
Even though comparing yourself to others doesn’t always do your mental health much good, it is a helpful benchmark to check yourself against, not to mention a hell of a curiosity cruncher. I’ve run the numbers which are available publicly from the Office for National Statistics Total Wealth survey. So, ever asked yourself how do I compare to the national average net worth? Let’s find out…
- What categories of wealth did they take account of?
- But first, a discussion on income
- Average net worth in the UK
- Average net worth by age in the UK – how do you stack up?
- Average net worth by education level in the UK
- Average net worth by income in the UK
- Average net worth by region
- How wealthy am I?
- How do I build my net worth?
- Conclusion
What categories of wealth did they take account of?
- net property wealth (value of any property owned minus any outstanding mortgages/loans against them)
- net financial wealth (the value of any financial assets such as savings and investments, less any debts like credit cards and consumer loans)
- private pension wealth
- physical wealth (self-evaluated value of household contents)
Both net property wealth and physical wealth are submitted by the survey respondents which is important to note as people tend to overstate the value (and it depends on physical wealth how much they include). However, as they have deducted any liabilities (such as mortgages or consumer debts), we can be confident we can compare our net worth against theirs.
Now that we’re aware of the different categories they count, lets jump into it…
But first, a discussion on income
Income tends to get the lion share of air-time, as people gun for higher and higher incomes and we hear stories of celebrated athletes earning hundreds of thousands of pounds per week. However, the real measure of whether you are rich or not is via your wealth and net worth.
Why? We’ve all heard stories of the athletes (here and here) with the lavish lifestyles who go broke once their careers end and their incomes drop. If someone is earning that much money they shouldn’t be able to go broke in my opinion. If they had funnelled more money into investments when they were earning megabucks, they would have been able to have a big enough portfolio that they could simply live off of the returns. That is why net worth is a much better yardstick to use for any comparisons.
On that note… lets get into it!
Average net worth in the UK
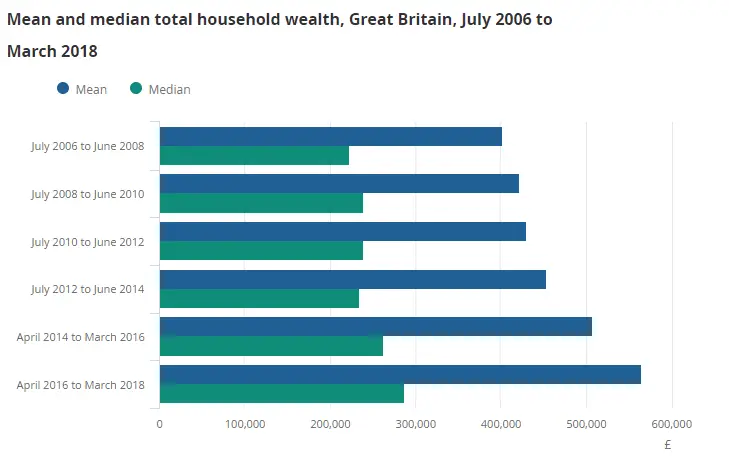
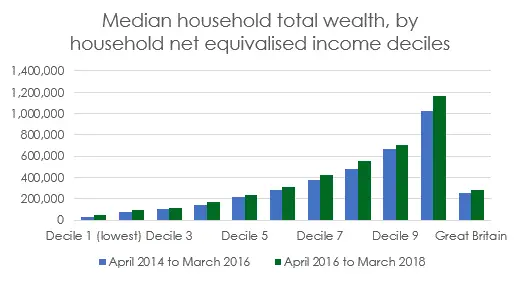
The median total household wealth between April 2016 and March 2018 was £286,600. This is a measure of the average wealth if you lined up all households from left to right based on their wealth, and you picked the one that was slap bang in the middle.
The mean average for the same period was £564,300. This is a different way of calculating the average, by taking the total household wealth and dividing by the total number of households. The fact that the mean is higher than the median average means that there is some inequality in wealth distribution.
In the chart below, you can see that both the median and the mean is increasing over time, but the mean is increasing at a much faster rate.
Average net worth by age in the UK – how do you stack up?
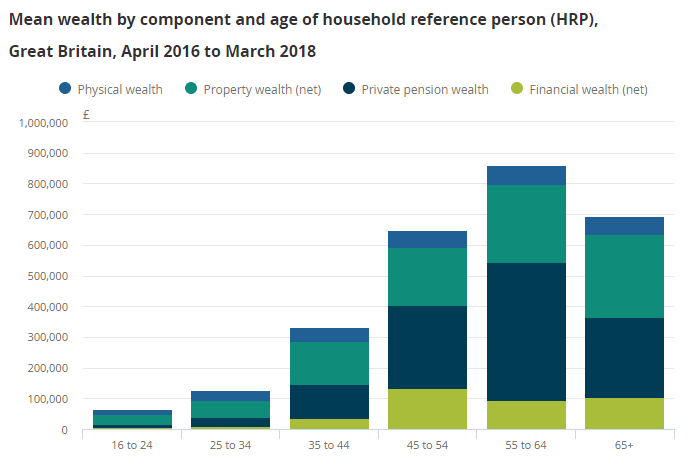
As you can see from the chart below, the average household wealth increases as you get older, until pension age where it starts to decline again as the wealth is called upon to pay for their retirement.
As you can see by the green and dark blue sections of the columns, most peoples wealth is dominated by both property wealth and private pension wealth.
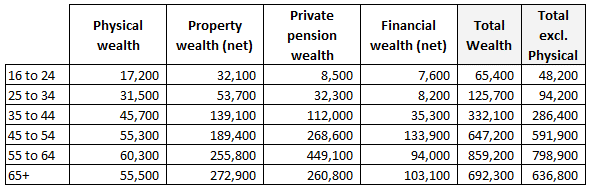
You can see the above in table form, showing that the total wealth excluding physical wealth is £48,200 for people aged 16-24, working all the way up to the peak in the age bracket 55 to 64 at £798,900.
I’ve also included a total which excludes physical wealth. Why? Even though some physical wealth can be resold (artworks etc), sticking with the “traditional” types of investment/wealth allows for better comparison; property, pension and financial.
I don’t know about you, but this is a sobering statistic that helps to put your efforts into perspective. I’m in the 25-34 age bracket, but I am currently behind the total wealth of my peer group average even though I am earning above the national average income-wise due to an indulgent 20s. Don’t worry if that is your current situation also, I’m working towards aggressively building my wealth and I’ll include some tips, later on, to help you put in place an action plan to start growing yours too.
However, there are a few things that will impact these lower age groups (16-24 and 25-34) that is worth calling out:
- The bank of Mum and Dad
- Outliers
It is estimated by Legal & General that the average contribution from “The Bank of Mum and Dad” in 2019 was £24,100 (higher in some areas like London where it is on average £31,000). These figures would show up in these age groups reported figures, so just bear this in mind.
Furthermore, splitting each age group down based on their wealth band allows you to drill a little deeper and uncover any influential outliers that are moving the mean average.
Now that it is split out below, you can see that the 16 to 24 group is dominated by over 60% of the age group having less than £20,000 wealth. Similarly in the age group 25 to 34, 55% of the age group have a wealthless than £85,000.
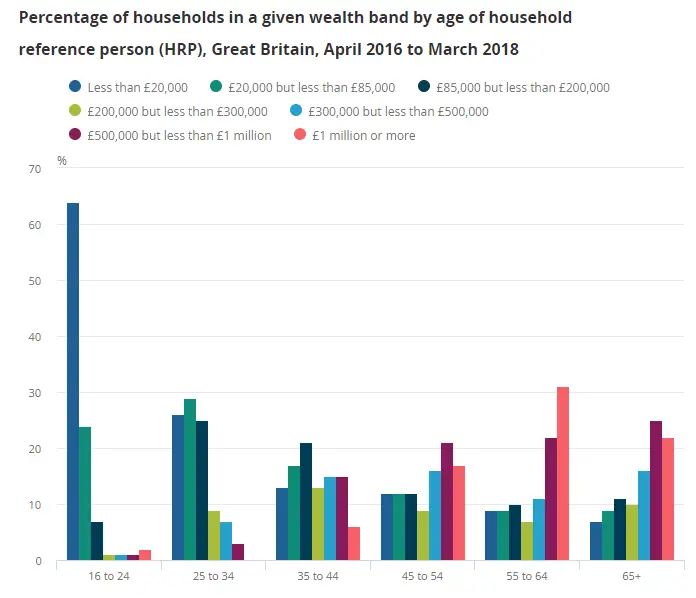
As you get to the older age groups, you can see that the proportion of households who have higher net worth starts to increase (as you would expect given compounding takes time). With the number of households of an age group who have wealth over £1million peaking in the 55 to 64 age group – with over 31% of this group having a wealth of more than £1m.
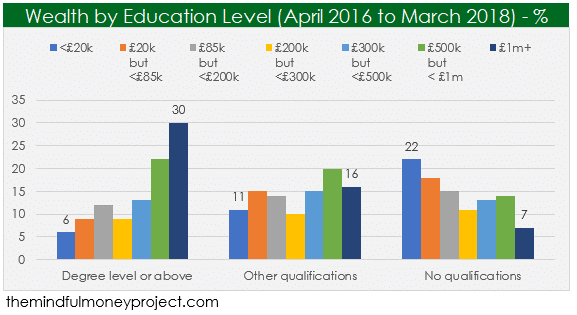
Average net worth by education level in the UK
Education still pays by the looks of this. 30% of households with a degree educated person have household wealth of £1m or more. Compared to 16% of households who are non-degree educated but have other qualifications, and only 7% of households with no qualifications.
Typically, a higher level of education results in higher income, which if managed properly should translate into higher wealth, so this comes as no surprise.
Average net worth by income in the UK
Unfortunately the ONS don’t provide the raw data for income groups, and instead show it against equivalised groups. I’ll leave it to them to explain…
To give a truer reflection of a household’s income than the raw figures, a process of “equivalisation” has been performed. This is a process that takes into account the size and composition of households. For example, we might expect two households of equal income to have different financial outcomes if one has a larger household size than another, or contains more dependents. Therefore, this adjustment means that the incomes of all households will be on a comparable basis
Office for National Statistics
We can see that as you climb the income bands, your wealth increases. This is to be expected, as those who earn more have the potential to save and invest more.
How does my income compare to the UK average?
Ever wondered how yours stacks up to the rest of the UK? The IFS have created a handy calculator that will tell you how you stack up.
Remember to use after-tax numbers in your inputs. You can get these by using The Salary Calculator’s take-home pay calculator.
Average net worth by region
There is quite a bit of variation in the median wealth by region, with the South East higher than London at £445,900 (likely due to the commuter belt), with the South West in second place at £372,600. The North East is lowest out of the regions with £172,900.

How wealthy am I?
To be able to compare your numbers, you’ll need to first understand your own net worth. To be able to compare it on the same basis as these ONS figures, you’ll need to tally up your:
- Property wealth minus any outstanding mortgages
- Financial wealth (savings, ISAs, investments) and minus off any consumer debt such as credit card balances or loans
- Pension wealth (your provider should be able to provide you this quite easily)
- Physical wealth
- I’m not a fan of including this, but tally up an estimate for items such as car, household contents, artwork etc. Some figures above I’ve stripped these out (I’ve referenced where this is the case).
How do I build my net worth?
So, you’re itching to get your numbers up. How do you go about doing it?
The key is to put yourself in a position where you are making a monthly personal profit. This is where your income is higher than your expenses and you have money available to funnel towards your goals.
You’ll need to use this monthly cash to save an emergency fund and pay off debt (excl. mortgage). When you’re done with that, you can start aggressively investing for long term growth, which is where the magic happens and compound returns can play its part to explode your wealth over time.
Your financial journey should look like the below, so will depend on your current situation:
- Build your personal profit by reducing expenses or earning more and set a budget to help you stick to it
- Save a small emergency fund of £1,000 (or 1 months’ worth of expenses, whichever is higher)
- Pay off all of your consumer debt (so no need to touch any mortgages)
- Build a larger emergency fund of 3-6 months’ worth of expenses (if your income is uncertain or you’re worried about it, shoot for 6 months)
- Invest!
Conclusion
Having an external benchmark is a helpful yardstick of how you are doing compared to the UK average, but remember that this is your journey. The statistics hide the nuances as well as the advantages other people may have had, such as inheritance or gifts.
As an example, the 16-24 age group average looked high at £65,400, but when you look at the split by wealth band, you can see that a small number of people with very high wealth (£1m+) in that age group will be skewing the mean average, with the bulk of people in this age group having less than £20k.
All that matters is your progress against your goals, so don’t be disheartened (or slack off!) based on these statistics. Follow the journey by paying off debt, saving an emergency fund and investing all whilst building your personal profit (by saving on expenses and increasing income) and you’ll be well on your way to building wealth above and beyond the average.
You got this!
Have you found these statistics motivating or sobering? What are your plans to grow your wealth? I’d love to hear more, so feel free to ping me an email or drop a comment below!
Wealthify vs Hargreaves Lansdown
Investing in the stock market used to be an inaccessible world full of jargon, stockbrokers…

How to Save Money Fast in the UK – 13 Easy Wins You Can Implement TODAY
Found yourself in a squeeze and looking to shoot rocket fuel into your personal finances?…
Budget Like A Boss – What Does My Budgeting Process Look Like?
If you’ve decided you need a budget, most people tend to advise a very similar…

Chip vs Plum: Which One Will Boost Your Money?
With personal finance, the aim of the game is to simplify and automate when and…

How To Cancel McAfee Subscription UK
Bored of your subscription or thinking of moving to a different provider? We’ve laid out…

How To Cancel Laithwaites Wine Plan UK
Bored of the service or wanting to move to a different wine subscription club? We…

Snoop vs Money Dashboard
An app has the power to simplify your life. Especially your finances. Rather than cracking…

17 Actionable Tips on How to Pay Off Debt Faster
You’re not alone. Living with debt has become a common issue for people in the…

How To Cancel Wall Street Journal (WSJ) Subscription in the UK?
You’re looking to cancel your Wall Street Journal (otherwise known as WSJ) subscription in the…

How to control impulse spending – 8 strategies that work
I’m sure every single one of you reading this has flirted with impulse spending in…

Pingback: What is the difference between income and wealth?
Pingback: How to save £1000 in a month using the COST method