It is often quite difficult to figure out whether your budgeted weekly food budget figures are actually reasonable or not, especially when you are basing your budget off of your own previous spending patterns.
This is a classic weakness to using your previous expenditure as the starting point in budgeting.
One way to counter this is to compare your own spending with an external benchmark.
How else will you find out that your toasted sesame seed, lemon-infused quinoa habit is trashing your ability to save cash?
Luckily, the Office for National Statistics run a survey each year giving us access to a plethora of data on the nation’s spending that will provide just such a benchmark (cheers ONS).
See how you compare with the national average food spend below.
- Where does this data come from?
- What is the national average food budget in the UK?
- What is the average food budget by household type?
- What is the average food budget for retirees and retired households?
- What is the average food budget based on income?
- What is the average food budget by household composition AND income?
- Going deeper – what takes up most of the food budget?
- Going deeper – where do people do most of their food shopping?
- What can we do to reduce our weekly food shop?
Where does this data come from?
Before we get started, lets quickly understand the source of this data.
I’ve taken the source data from The Office for National Statistics’ annual Living Costs and Food Survey in the UK.
This is a sample survey of private households to understand more about how people spend their money and how it changes over time.
This survey covers over 5,000 different households, asking them to complete an interview and then an expenditure diary for 2 weeks.
It is also continuous, which means it is happening throughout the year, so any impact of seasonality in spending is also included in these averages.
Obviously this information is extremely useful to the government (which is why they do the survey), but luckily they also publish this data openly, which means it is extremely useful to us too!
I’ve taken the “Food & Non-Alcoholic Drinks” data for the below, which doesn’t include any money spent on eating out at restaurants or ordering takeaways. Similarly, unless I’ve stated it, no alcohol spend is included so bear this in mind when comparing to your own budget.
What is the national average food budget in the UK?
The national average weekly food spend is £61.90 per week per household. This is spend on food & non-alcoholic drinks (excluding any spend on restaurants and eating out).
This equates to £268.23 per month, and £3,218.80 per year per household. However, this is a blended average based on all types of households, with the average number of persons per household is 2.4.
How much does the average person spend on food per week? £26 per week which equates to £111.76 per month and £1,341.17 per year.
This per person metric is more useful, however as it is an average it includes averages across regions, income levels and household composition. We’ve been able to break the data down to help you find the right benchmark which applies to your situation.
Household type and income are the most important so let’s split this data up to give you a more useful comparative.
What is the average food budget by household type?
This should be a more useful comparative for you to use, as you can take your own house composition to check against your own budget.
Unsurprisingly, we can see in the chart below that as your household size increases (either with additional adults or additional children) your weekly food bills increase (blue line in the below chart).
However, as the household size increases, the per-person costs decrease (green bars in the below chart).

You can see this in the households made up of two adults, where the weekly food spend goes from £30 per person in a house of 2 adults down to £18 per person in a house of two adults and 3 or more children.
This is intuitive, as you know when you have more mouths to feed you can buy in bulk and typically when you buy larger amounts, the price per serving decreases.
This is the personal finance equivalent of economies of scale that businesses experience when they get bigger.
Not only that, but households with children see a bigger reduction in the per-person spend which makes sense as a typical child will eat less than a typical adult.
From this chart and the table below, we can say a reasonable weekly food shop for differing households are as below:
Average food budget for 1 person: £32
Average food budget for 2 (i.e a couple living together): £60
Average food budget for a family of 3 (i.e 2 adults and 1 child): £73
Average food budget for a family of 4 (i.e 2 adults and 2 children): £86
| Food & Non-Alcoholic Drinks Spend | Weekly | Monthly | Yearly | |||
| Household Composition | Per Person | Per Household | Per Person | Per Household | Per Person | Per Household |
| 1 adult, no children | 32 | 32 | 137 | 137 | 1,648 | 1,648 |
| 1 adult, 1 child | 23 | 47 | 101 | 202 | 1,209 | 2,418 |
| 1 adult, 2 or more children | 16 | 52 | 68 | 224 | 815 | 2,688 |
| 2 adults, no children | 30 | 60 | 131 | 261 | 1,568 | 3,136 |
| 2 adults, 1 child | 24 | 73 | 105 | 316 | 1,265 | 3,796 |
| 2 adults, 2 children | 21 | 86 | 93 | 372 | 1,117 | 4,467 |
| 2 adults, 3 or more children | 18 | 99 | 80 | 430 | 955 | 5,158 |
| 3+ adults, no children | 27 | 91 | 116 | 395 | 1,393 | 4,737 |
| 3+ adults, with children | 21 | 102 | 90 | 443 | 1,086 | 5,320 |
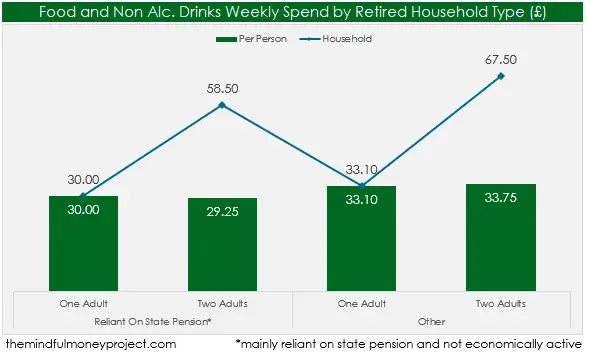
What is the average food budget for retirees and retired households?
If you’re retired, the below provides a more suitable benchmark based on other retired households.
The average per-person food spend is higher in retired households who are not reliant on the state pension and/or are still economically active – unsurprising given they are likely to have a higher income.
These households spend on average £33.10 per person, compared to £30 for the equivalent 1 adult household who is reliant on the state pension and not economically active.
Average food budget for retirees not reliant on state pension: £33.10 (one adult household)
Average food budget for retirees reliant on state pension: £30 (one adult household)
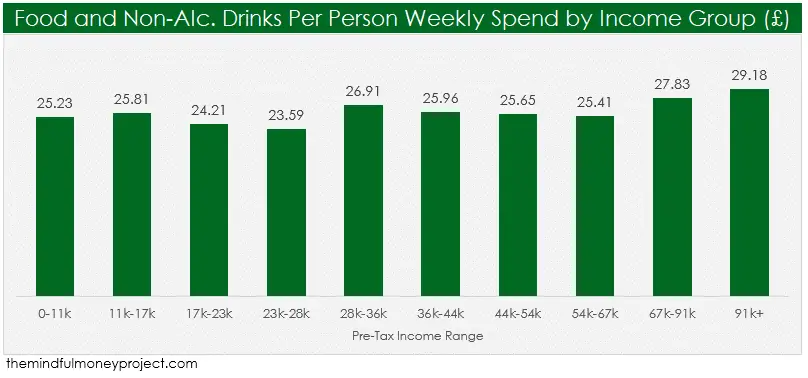
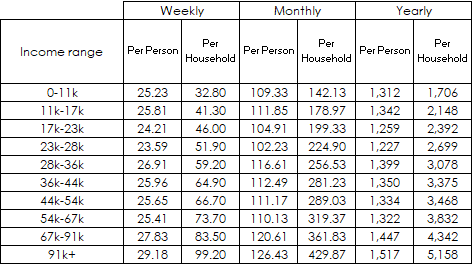
What is the average food budget based on income?
As gross income (income before tax) rises, so too does the amount that is being spent on food and non-alcoholic drinks on average each week.
This is unsurprising, as food costs become a smaller proportion of income at the higher income groups, and their higher incomes can support higher food expenses.
As incomes rise from the bottom bracket of £0-£11k per year up to the top bracket of £91k+, the per person weekly food shop also increases from £25.23 to £29.18, as you can see below.
Interestingly, the average per person weekly spend actually reduces as you start to climb through the income groups, before starting to increase again past the £28k mark.
When we look at the impact on the household total budget (rather than just per person) we see the weekly spend increase with the higher incomes, partly due to the higher per person spend, but also partly because these households have more people per household on average (3.4 at 91k+ vs 1.3 at 0-11k).
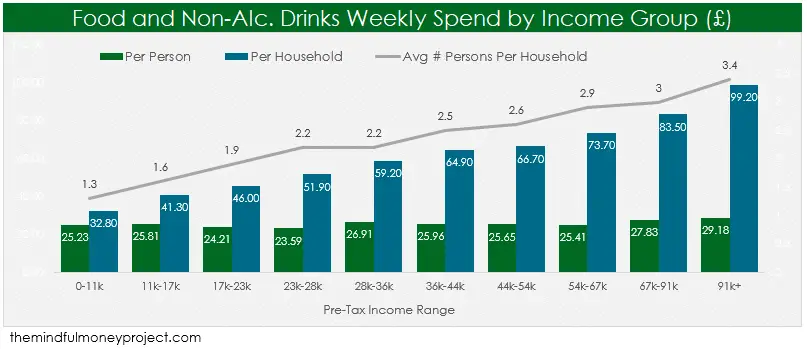
Below I’ve pulled out a table which provides the monthly and yearly equivalents based on the annual income ranges (pre-tax).
What is the average food budget by household composition AND income?
This will help you to really narrow down an accurate benchmark for your budgeting. Income AND household composition together.
However, there isn’t quite as much data being shared by the ONS on these 2 dimensions combined, so we can only share this for:
- 1 adult, no children households
- 2 adult, no children households
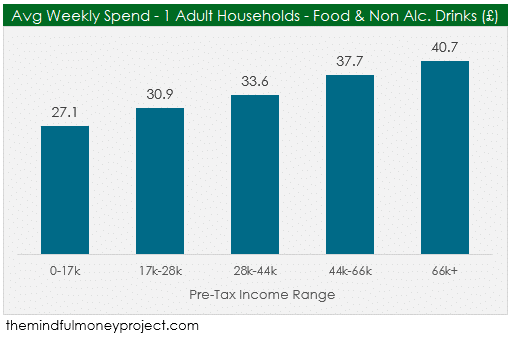
Average food budget for 1 adult household based on income
For 1 adult households with no children, the average weekly food spend per person is £27.10 for the income range £0-£17k, increasing up the income groups to £40.70 if earnings are more than £66k.
What is the typical monthly food budget for 1 in the UK? Assuming you live by yourself, the average monthly grocery bill for one person in the UK is £137 (£32 per week).
However, this changes based on income, ranging from £117 (£27.10 per week) for people earning £17k per year or less, all the way up to £176 (£40.70 per week) for those earning more than £66k+.
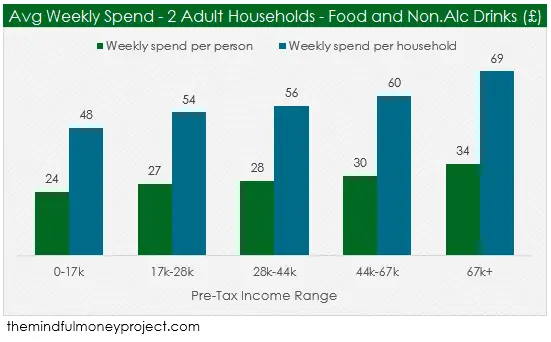
Average food budget for a couple living together (no children)
For 2 adult households without children, the per person food spend is lower (as expected due to the ability to buy in larger quantities) – this is seen across all income groups, with the bracket £28k-£44k coming down from £33.60 per person per week in 1 adult households to £28 per person per week in 2 adult households.
The average food bill for 2 adults in the UK (with no children) is £261 per month (£60 per week), which works out per person at £131 per month (£30 per week). As a reminder, this is without spending out at restaurants or on alcoholic drinks.
Going deeper – what takes up most of the food budget?
There is a fascinating amount of detail in the survey, and based on the data the average weekly food shop of £61.90 has the top 5 spend items:
- “Other Meats and Meat Preparations” (i.e sausages/offal/pate/preserved or processed meat) – £6.60
- Bread, rice and cereals – £5.50
- Fresh vegetables – £4.40
- Fresh fruit – £4.10
- Buns, cakes, biscuits etc – £3.90
- Fish and fish products – £3.00
- “Other Food Products” (i.e sauces, condiments, spices, salt, soups, bakers yeast etc) – £2.70
- Poultry (fresh, chilled or frozen) – £2.30
I’m heartened to see both fresh fruit and veg up there!
There are some interesting observations when you compare across income ranges, with people in higher income brackets spending less as a proportion of their total weekly food bill on items such as;
- Buns, cakes and biscuits
- Milk
- Confectionery products
- Ice cream / “edible ices”
- Coffee
However, the higher income groups tend to spend more as a proportion of their weekly food shop on:
- Fish
- Cheese
- Beef
- Lamb
Going deeper – where do people do most of their food shopping?
Unsurprisingly, the large supermarket chains dominate, taking 79% of the average weekly food spend, with 15% going to other outlets and only 6% going through the internet (this includes any internet based spending with the large supermarkets).
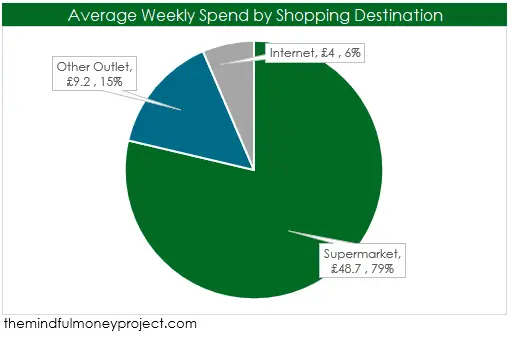
Of course, this data is up until the end of financial year 2019 (March 2019) and so has changed very dramatically as a result of the COVID19 pandemic and the subsequent lockdowns forcing people to change their shopping behaviour – some even quoting figures as high as 77% now doing some of their shopping online.
What can we do to reduce our weekly food shop?
Benchmark your budget
The first priority is to use the data above to work out how your own previous spending (or your budget) compares.
If you’re a 1 adult household, compare your spending against both the average for 1 adult households above, as well as the 1 adult household split by income type to see how you compare.
In order to do this, you’ll need to have an idea of your standard / average weekly food shop – if you haven’t already, run through your past 6-12 months’ worth of transactions to nail down your average spend per month on each main line item (Food, Entertainment, Travel, Housing, Holidays are mine) and build yourself a budget. If that sounds like a right bore, then automate the process using an app like Snoop or Money Dashboard.
Challenge yourself to drop a level
If your spending and/or budget is currently matching your benchmark (i.e if you’re a 1 adult household and are spending £32 per week on food), I would try challenging yourself to try and drop to the level below and see if you can do it.
By looking at the fact that 1 adult weekly food budget varies so much based on income level suggests that you can certainly make savings.
There are a tonne of resources online for how to cook well on the cheap, but a few good places to start;
- Swap out meat for veggie/ potato dishes – super easy, super quick and good for the environment!
- Cook in bulk – from scratch, so no pre-made sauces / jars!
- Drop a supermarket down – if you normally shop at Sainsburys, try shopping in Aldi/Lidl
- Drop a brand down – if you normally buy a brand, try buying the supermarket’s own brand.
- Drop a meat cut – eh? By this I mean drop down a level in the cut of meat you normally buy. If you normally buy chicken breasts, go for the chicken thighs instead. Normally go for steak mince, go for lean beef mince or turkey mince instead.
- Draw up a shopping list – it’ll keep you disciplined and focused, removing any impulse buys you don’t really need
- Meal planning – this will help to reduce the amount of wastage (which means lower costs) and the structure will help with the above shopping list!
- Try shopping online – less people are tempted by impulse buys and should result in a more disciplined shop (let alone the additional time you’ll have back by not having to go to the shops!)
- Always check the standardised price – offers and deals tend to sucker you in and makes it look like a good offer, but be sure to check the price per unit i.e price per 100g or price per L etc depending on what you’re buying – that will make price comparison super easy to do on the fly without wasting a tonne of time
These suggestions are a super-easy way to install some easy, recurring savings into your budget and spend – perfect for pumping up your personal profit. The bigger your household, the bigger the potential savings.
However, I would be very mindful of spending too much time on looking for money-saving deals. If it takes you 15 minutes to calculate and win a saving of £0.80 on your groceries, you’re in too deep. Don’t obsess about these savings past a certain point. Find a rhythm with the tips that work for you, but discard the ones that don’t. Always remember to focus on the right things, and spending hours and hours a week on finding £5 worth of savings is probably not worth your time – you could be putting those hours into building some income instead.
See related: how to save £1000 in a month using the COST method & how to save money on food without cooking
Already under your benchmark?
Good work!
I’d sit back and relax if I were you, safe in the knowledge you’re being more frugal than the typical person in your situation.
You have a choice, you can either;
- keep on spending at your current level on food (and therefore keep your budget the same) if your current lifestyle is sustainable (meaning that you are making a personal profit each month and you’re not sacrificing too much on your lifestyle on the food front).
- OR, increase your food budget so it is in line with the benchmark, enjoy the additional luxuries it helps offer you, safe in the knowledge that it isn’t too decadent for someone in your position. However, if you are still yet to turn a consistent personal profit, I would not recommend this option.
Track your spending
Using a budgeting and spend tracking app like Snoop or Money Dashboard will help you to easily track your food and grocery spend over time. Both these apps are free and connect securely to your bank account via the Open Banking API.
As you increase visibility of your spending, it becomes more motivating to find ways to do more with less and reduce your grocery expenses. Plus, it helps to keep you accountable for hitting your budget if you have one.
Keep lifestyle inflation in check
This is so key.
If you have found a manageable level with your groceries and weekly food shop, then why change when you grow your income?
We’ve seen from the above data that people increase their food shop remarkably when they increase their income. Even if the proportion of spend on food decreases, the absolute is still increasing.
If you keep your expenses, of which food is a big one, flat whilst you grow your income, you will be growing a higher and higher savings rate as none of that additional income is “lost” on your expenses growing.
Especially if you have an aggressive financial goal, try to keep your discipline.
Find a level of food spending that allows you to live a sustainable lifestyle – by which one I mean you can enjoy indefinitely (this means not a tonne of sacrifice, but it does mean discipline and mindfulness with your spending).
Once you’ve found that level, try to keep it at that level even as your income increases.
If you keep socking away that sweet, sweet personal profit into savings and investments, you’ll soon start generating passive income from your investments that will mean your income is even higher, and more secure (as it is diversified), and at this point you can start to increase your spending level if your portfolio/passive income allows it.
See related: what should I do with spare cash?
Hope you enjoyed this data-heavy article today! Would love to hear more about how you manage your weekly food shop and weekly grocery bills and any tips you’ve picked up to stay on top of it? Let me know in the comments below!
*Any links with an asterisk may be affiliate links. Even though we may receive a payment if you use this link to sign up for the service, it does not influence our editorial content and we remain independent. The views expressed are based on our own experience and independent analysis of the service.
Data Source: The Office for National Statistics – Living Costs and Food Survey

What Is A Good Amount Of Savings UK?
Generally in life, more tends to be better. But is that true for savings? Whilst…

“Why Should I Track My Expenses?” – We’ve got 7 reasons why!
Tracking your expenses isn’t all about firing up a spreadsheet and restricting your spending. Having…

How To Cancel Graze Subscription UK
Bored of your Graze boxes or want to try a competitor’s version? We get you….

How To Cancel Hellofresh Subscription UK
Bored of the meal kits or want to try a competitor? We get you. We’ve…

How To Cancel Les Mills On Demand UK
Bored of your subscription or wanting to move to another provider? We get you. We’ve…

How To Cancel Laithwaites Wine Plan UK
Bored of the service or wanting to move to a different wine subscription club? We…

Pingback: How to create a budget in excel that'll even impress your accountant!
Pingback: How to budget when you get paid weekly
Pingback: What are the benefits of budgeting? | The Mindful Money Project